




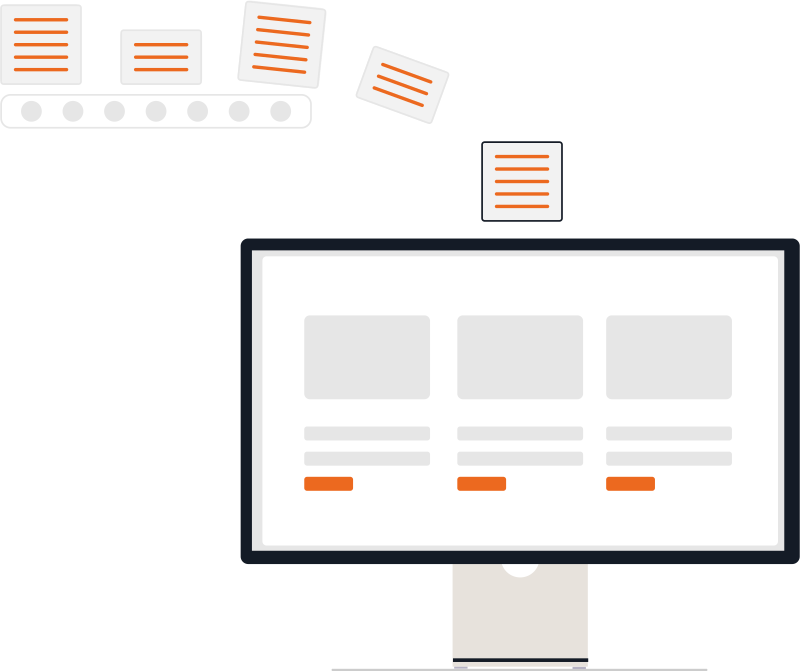
What is a business intelligence dashboard?
A business intelligence dashboard is a single screen that shows your key numbers, such as sales, collections, stock or service levels, pulled automatically from the systems where that data lives. It updates on a schedule or in real time, lets you filter by branch, team or period, and replaces reports that someone builds by hand in Excel.
In many businesses the monthly MIS is a spreadsheet that one person assembles from five different exports. It takes days, it breaks when that person is on leave, and by the time it reaches the owner the numbers are already old. Different teams often quote different figures for the same thing.
We bring your data into one clean, well-defined place and build dashboards on top of it. Sales, finance and operations see the same numbers, defined the same way, refreshed automatically. When a figure looks wrong, anyone can drill down to the underlying records and see where it came from.
From raw data to decisions
We start by agreeing the questions your team needs answered and the definitions behind each metric. Then we build pipelines that pull data from your ERP, CRM, Tally, billing software, Google Sheets and ad platforms, clean it and store it in a reporting database. On top of that we design dashboards in Power BI, Looker Studio or a custom web view, with role-based access, scheduled email reports and alerts when a number crosses a limit.
- Live dashboards
- Automated MIS reports
- Data pipelines
- Forecasting & trends
What is included
- Metric definitions and reporting requirements
- Data pipelines from ERP, CRM, Tally and sheets
- Reporting database and data cleaning
- Dashboards with role-based access
- Scheduled MIS reports and threshold alerts
What changes for your business
One version of the truth
Every team works from the same definitions, so meetings discuss decisions rather than whose number is right.
Reports without the scramble
MIS that took days to compile is ready on schedule without anyone copying and pasting.
Problems spotted early
Alerts flag slow collections, low stock or missed targets while there is still time to act.
How we work
Assess
We understand your processes and uncover high-impact opportunities.
Pilot
We start small and prove value fast.
Scale
We roll out across teams and systems.
Support
We stay with you and keep everything running.
Industries we deliver this for
 NBFC & Lending
 Banking & Co-operative Banks
 Manufacturing
 Retail & E-commerce
 Logistics & Supply Chain
 Pharma & Life Sciences
 FMCG & Distribution
 Construction & Infrastructure
Ways to work with us
Fixed-scope project
Clear deliverables, timeline and acceptance criteria agreed before work starts. Best for defined builds.
Phased programme
Larger change delivered in stages, each with its own scope and review, so priorities can adjust.
Dedicated team
Developers, designers or testers from our in-house team working on your roadmap, month by month.
Annual maintenance (AMC)
Yearly care for websites and apps: updates, security, backups, fixes and small changes.
Questions about Data & Dashboards
Last updated November 2026


